geekmom.com
Full analysis available
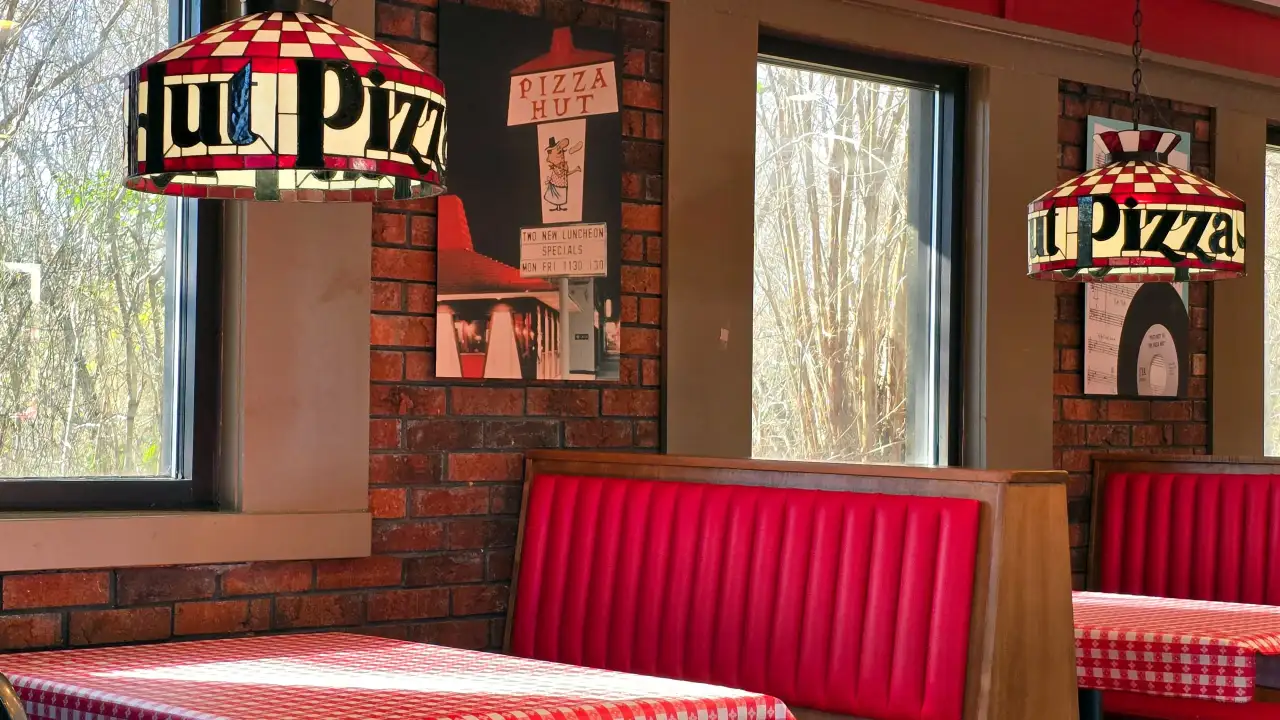
Do Americans Really Want Pizza Hut's Retro Red Roof Revival?
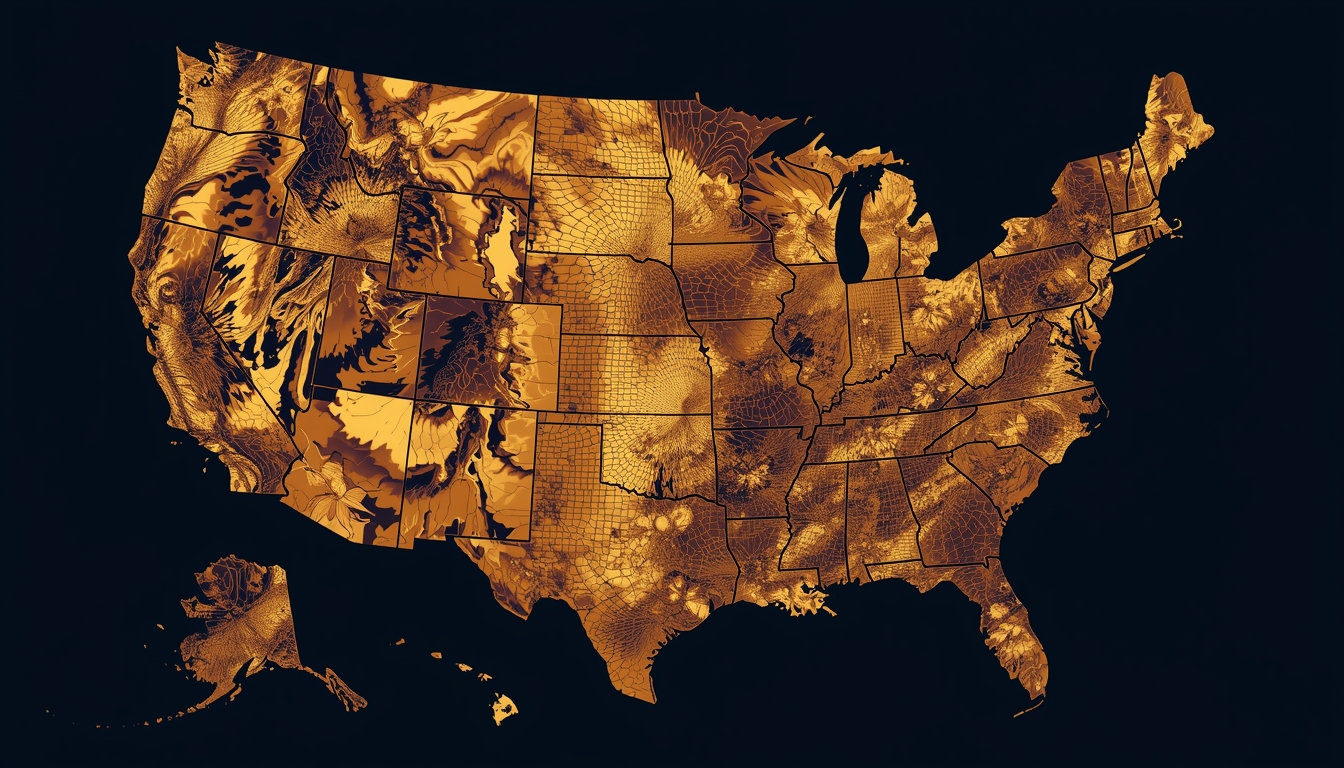
A new poll reveals 80% of respondents favor nostalgic Pizza Hut renovations, but regional preferences show surprising splits on the classic dining experience. The data suggests Americans may be ready to embrace the chain's iconic past.
Showing 0 responses matching:
Would you want your local Pizza Hut to be renovated to the Classic style?

Yes, I love the nostalgic look

No, I prefer a more modern style
Total: 10 votes
What state do you live in?
| Yes, I love the nost... | No, I prefer a more... | |
|---|---|---|
| Alabama | 0% | 0% |
| Alaska | 0% | 0% |
| Arizona | 0% | 0% |
| Arkansas | 0% | 0% |
| California | 100% | 0% |
| Colorado | 0% | 0% |
| Connecticut | 80% | 20% |
| Delaware | 0% | 0% |
| District of Columbia | 0% | 0% |
| Florida | 100% | 0% |
| Georgia | 0% | 0% |
| Hawaii | 0% | 0% |
| Idaho | 0% | 0% |
| Illinois | 0% | 0% |
| Indiana | 0% | 0% |
| Iowa | 0% | 0% |
| Kansas | 0% | 0% |
| Kentucky | 0% | 0% |
| Louisiana | 0% | 0% |
| Maine | 0% | 0% |
| Maryland | 0% | 0% |
| Massachusetts | 0% | 0% |
| Michigan | 0% | 0% |
| Minnesota | 0% | 0% |
| Mississippi | 0% | 0% |
| Missouri | 0% | 0% |
| Montana | 0% | 0% |
| Nebraska | 0% | 0% |
| Nevada | 0% | 0% |
| New Hampshire | 0% | 0% |
| New Jersey | 0% | 0% |
| New Mexico | 0% | 0% |
| New York | 0% | 0% |
| North Carolina | 0% | 0% |
| North Dakota | 0% | 0% |
| Ohio | 0% | 0% |
| Oklahoma | 0% | 0% |
| Oregon | 0% | 0% |
| Pennsylvania | 0% | 0% |
| Rhode Island | 0% | 0% |
| South Carolina | 0% | 0% |
| South Dakota | 0% | 0% |
| Tennessee | 0% | 0% |
| Texas | 100% | 0% |
| Utah | 0% | 0% |
| Vermont | 0% | 0% |
| Virginia | 0% | 0% |
| Washington | 0% | 0% |
| West Virginia | 0% | 0% |
| Wisconsin | 0% | 0% |
| Wyoming | 0% | 0% |
| Other/Outside US | 0% | 0% |
Would you enjoy the pizza buffet?
Total: 10 votes
What state do you live in?
| Yes | No, I'd prefer just... | |
|---|---|---|
| Alabama | 0% | 0% |
| Alaska | 0% | 0% |
| Arizona | 0% | 0% |
| Arkansas | 0% | 0% |
| California | 100% | 0% |
| Colorado | 0% | 0% |
| Connecticut | 60% | 40% |
| Delaware | 0% | 0% |
| District of Columbia | 0% | 0% |
| Florida | 100% | 0% |
| Georgia | 0% | 0% |
| Hawaii | 0% | 0% |
| Idaho | 0% | 0% |
| Illinois | 0% | 0% |
| Indiana | 0% | 0% |
| Iowa | 0% | 0% |
| Kansas | 0% | 0% |
| Kentucky | 0% | 0% |
| Louisiana | 0% | 0% |
| Maine | 0% | 0% |
| Maryland | 0% | 0% |
| Massachusetts | 0% | 0% |
| Michigan | 0% | 0% |
| Minnesota | 0% | 0% |
| Mississippi | 0% | 0% |
| Missouri | 0% | 0% |
| Montana | 0% | 0% |
| Nebraska | 0% | 0% |
| Nevada | 0% | 0% |
| New Hampshire | 0% | 0% |
| New Jersey | 0% | 0% |
| New Mexico | 0% | 0% |
| New York | 0% | 0% |
| North Carolina | 0% | 0% |
| North Dakota | 0% | 0% |
| Ohio | 0% | 0% |
| Oklahoma | 0% | 0% |
| Oregon | 0% | 0% |
| Pennsylvania | 0% | 0% |
| Rhode Island | 0% | 0% |
| South Carolina | 0% | 0% |
| South Dakota | 0% | 0% |
| Tennessee | 0% | 0% |
| Texas | 100% | 0% |
| Utah | 0% | 0% |
| Vermont | 0% | 0% |
| Virginia | 0% | 0% |
| Washington | 0% | 0% |
| West Virginia | 0% | 0% |
| Wisconsin | 0% | 0% |
| Wyoming | 0% | 0% |
| Other/Outside US | 0% | 0% |
- 10 total responses
- Self-selected online poll
- Fraud protection enabled
- Duplicate prevention active
Results are for informational and entertainment purposes only.
- 10 total responses
- Self-selected online poll
- Fraud protection enabled
- Duplicate prevention active
Results are for informational and entertainment purposes only.


Report This Poll
Help us keep ThoughtCove safe. Reports are reviewed by our team.
Report Submitted
Thank you. Our team will review this poll.